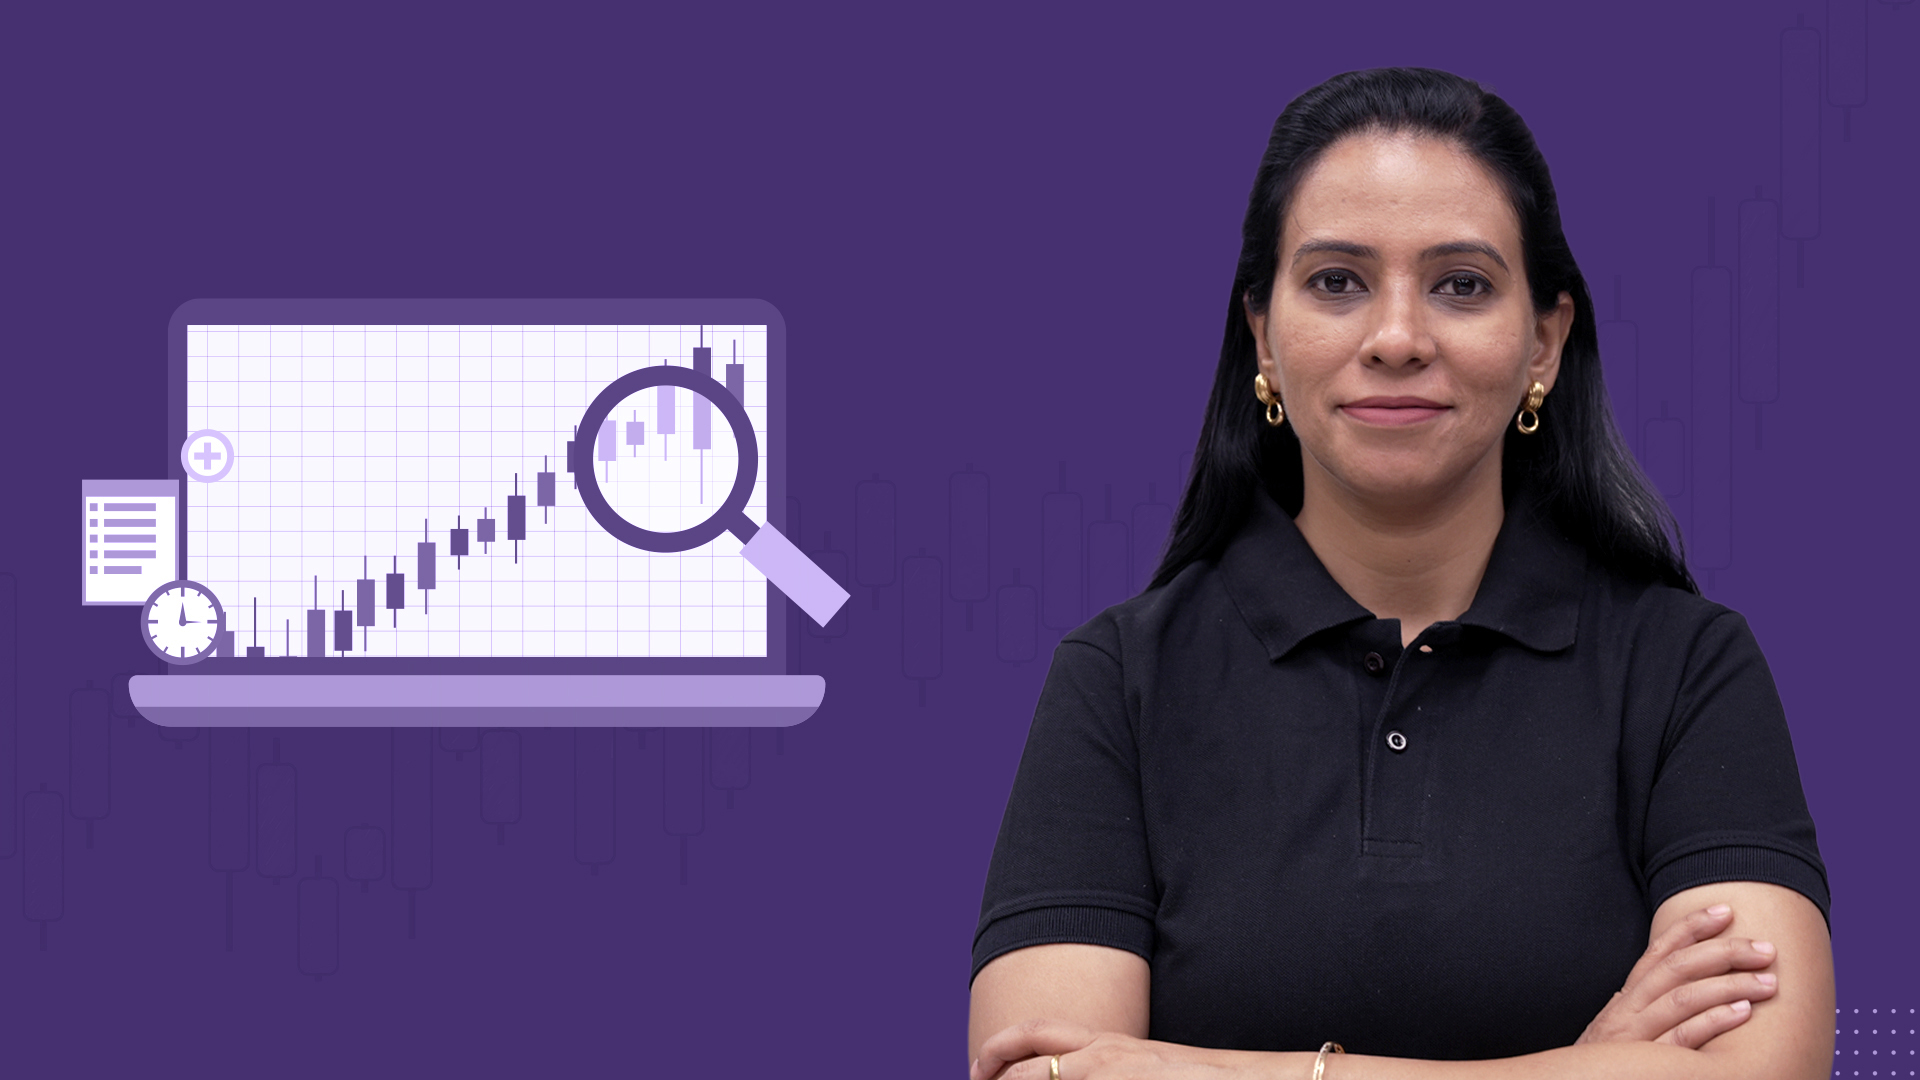
Master multi-timeframe analysis, volume profile, and momentum indicators used by professional traders.
Already comfortable reading stock charts? It's time to take your trading to the next level.
Our Advanced Technical Analysis Course dives deep into the sophisticated tools and techniques that experienced traders rely on to stay ahead of the market. This course is designed for those who understand the basics but want to refine their edge with powerful strategies and nuanced chart reading.
Explore advanced concepts like multi-timeframe analysis, candlestick psychology, volume profile techniques, and momentum-based indicators. Learn how to interpret divergences, identify high-probability breakout and reversal setups, and apply advanced risk-reward frameworks. We'll also cover dynamic patterns, price-action based strategies, and institutional trading cues to help you anticipate moves before they happen.
Whether you're looking to sharpen your existing strategy or build a new system from scratch, this course empowers you with the precision and confidence to make smarter, faster, and more profitable decisions in every market condition.
Garima Malik
Garima has 20 years of expertise in data analytics and technology leadership. A market trends expert and fintech innovator, she simplifies Technical Analysis for traders. Before Vidfin, she led large-scale fintech products as Director of Technology at a Fortune 500 company. She holds a PGP in Business Analytics and a B.Tech degree.